After Monday, the giant ball of OEWeeks Tweets is growing, as shown in the Twitter Tags Conversation Explorer:
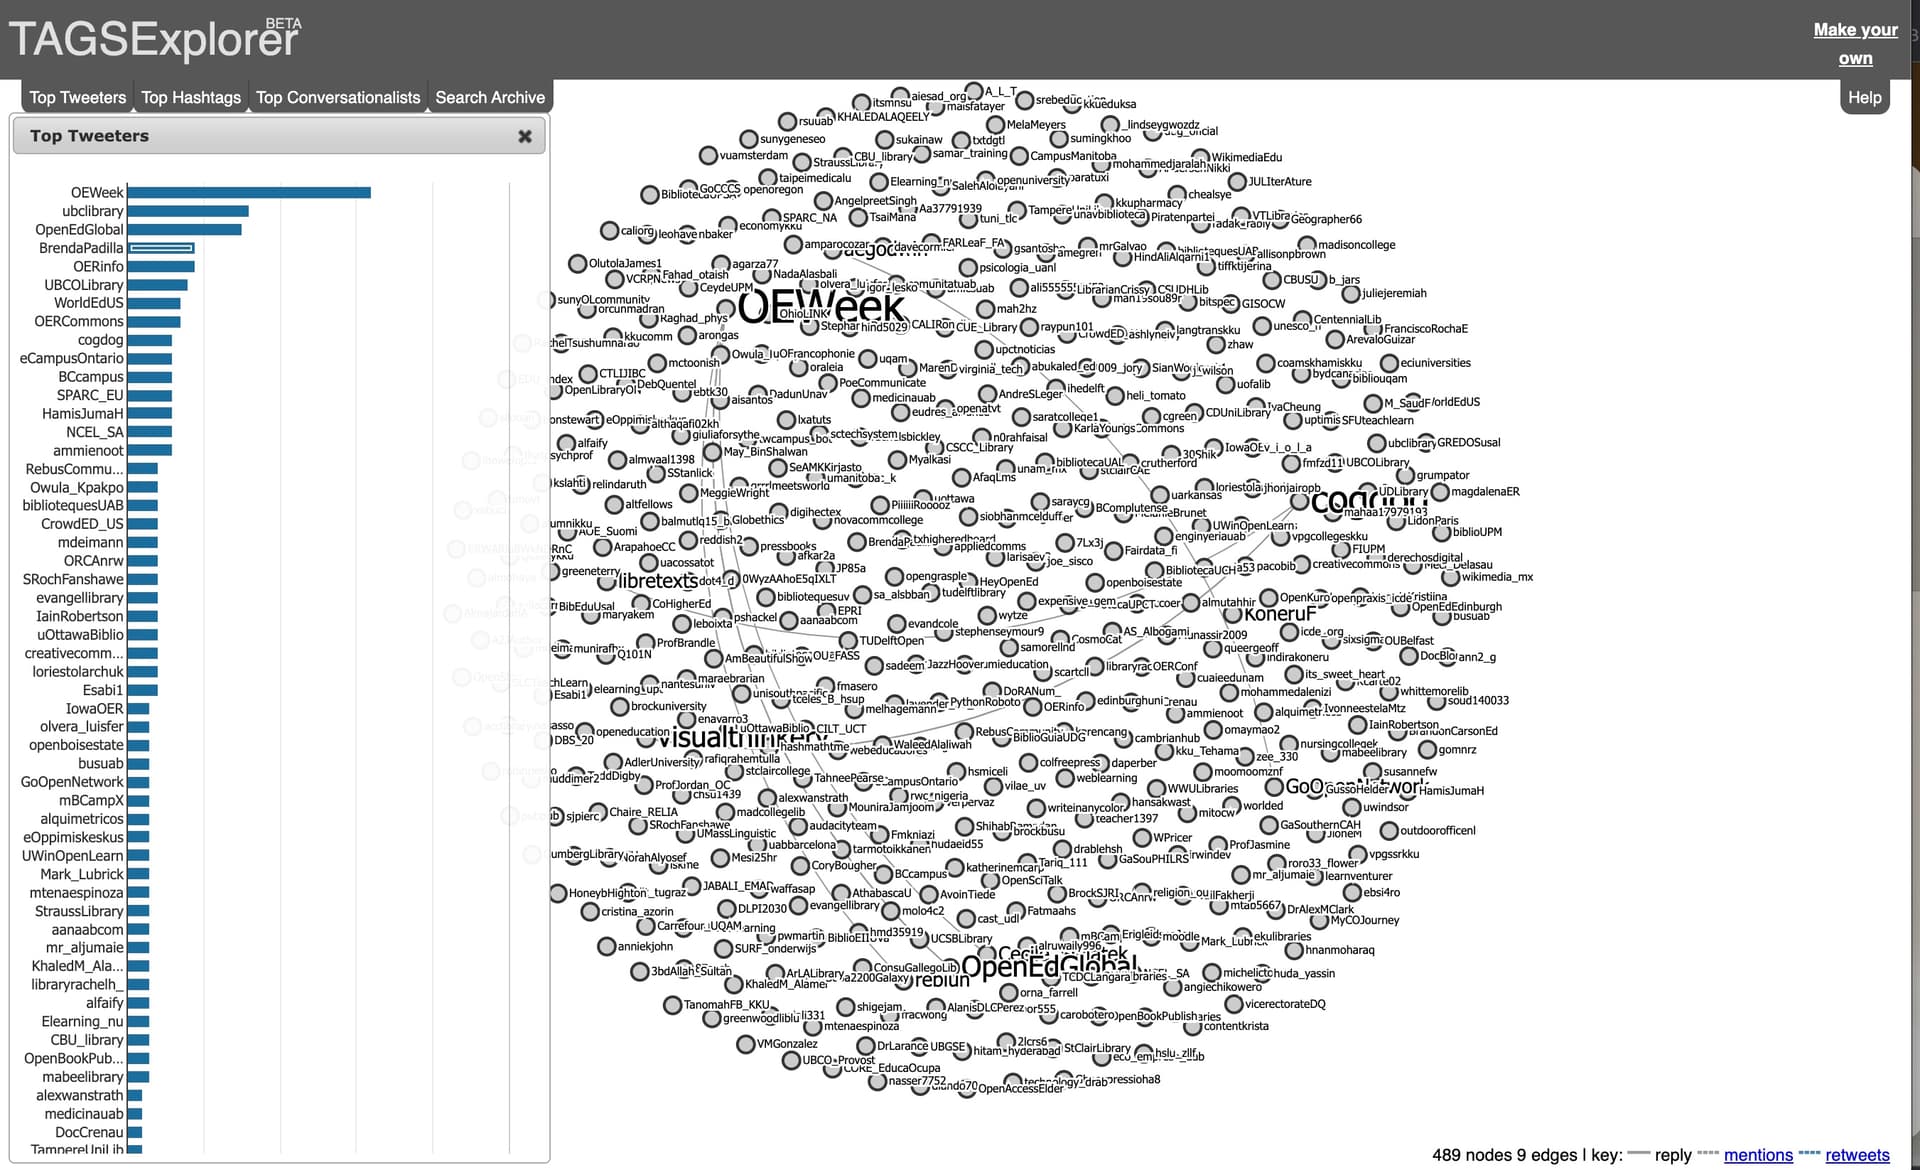
That’s over 700 tweets as of the first day of OEWeek including over 600 share links (see the summary).
Remember that lines represent mentions or replies to others.
Keep on Tweeting with the #OEWeek hashtag.