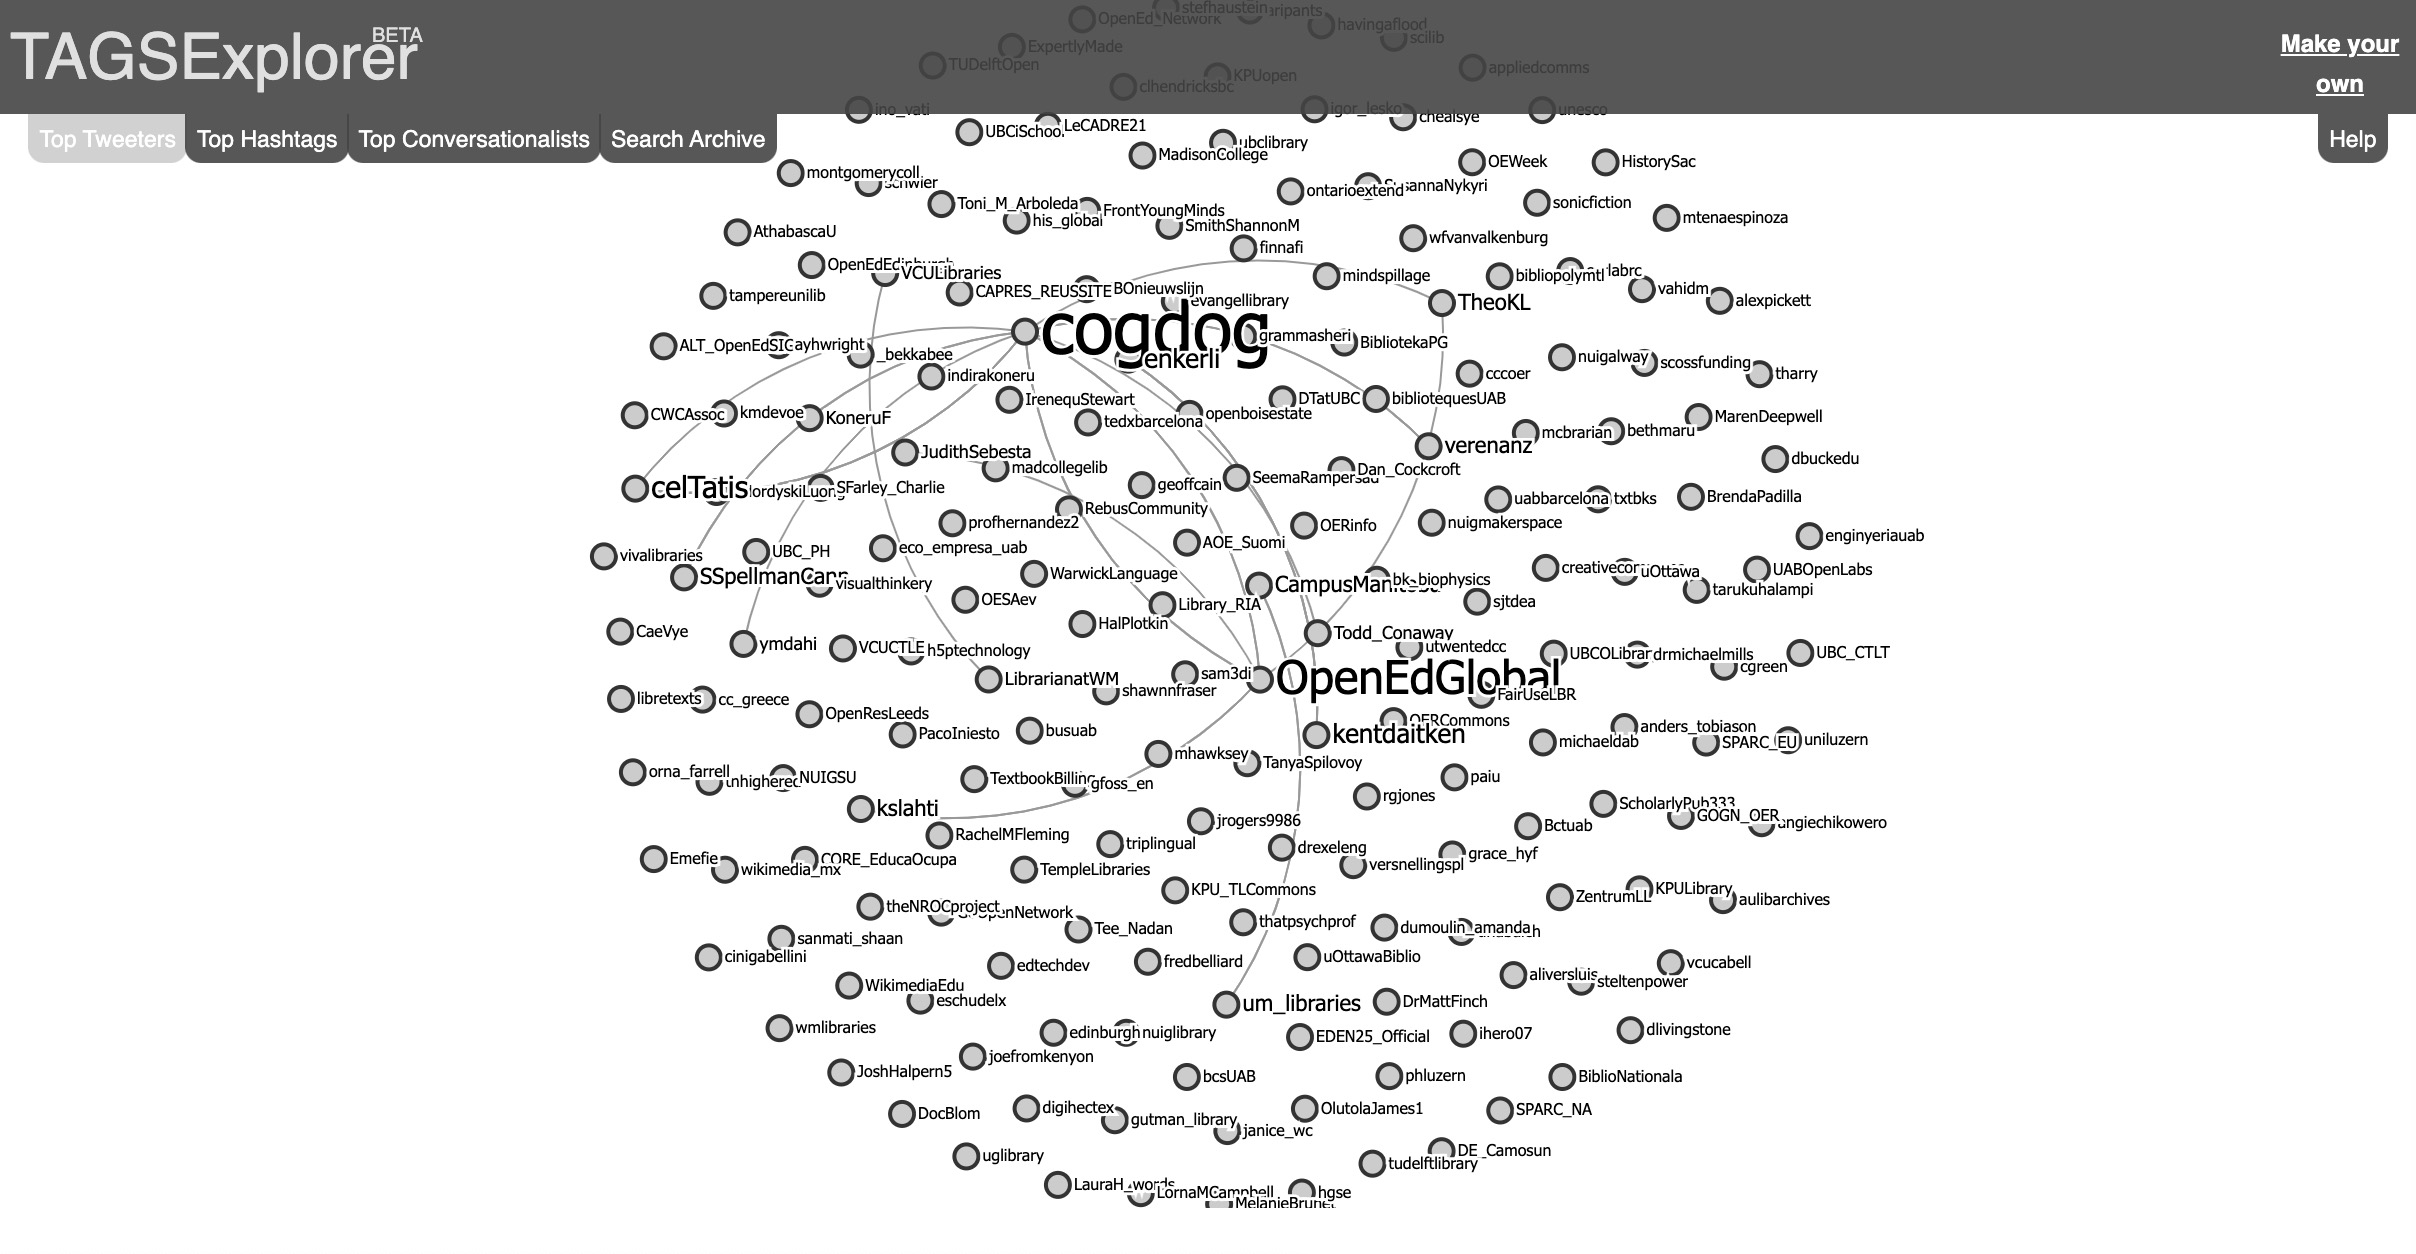
Like we did last year, we have set up a new Twitter TAGs archive/visualizer to share activity in twitter.
We use the the Google Worksheet developed/shared by Martin Hawksey to curate all tweets tagged #oeweek.
You can view the full archive of tweets or see summary statistics.
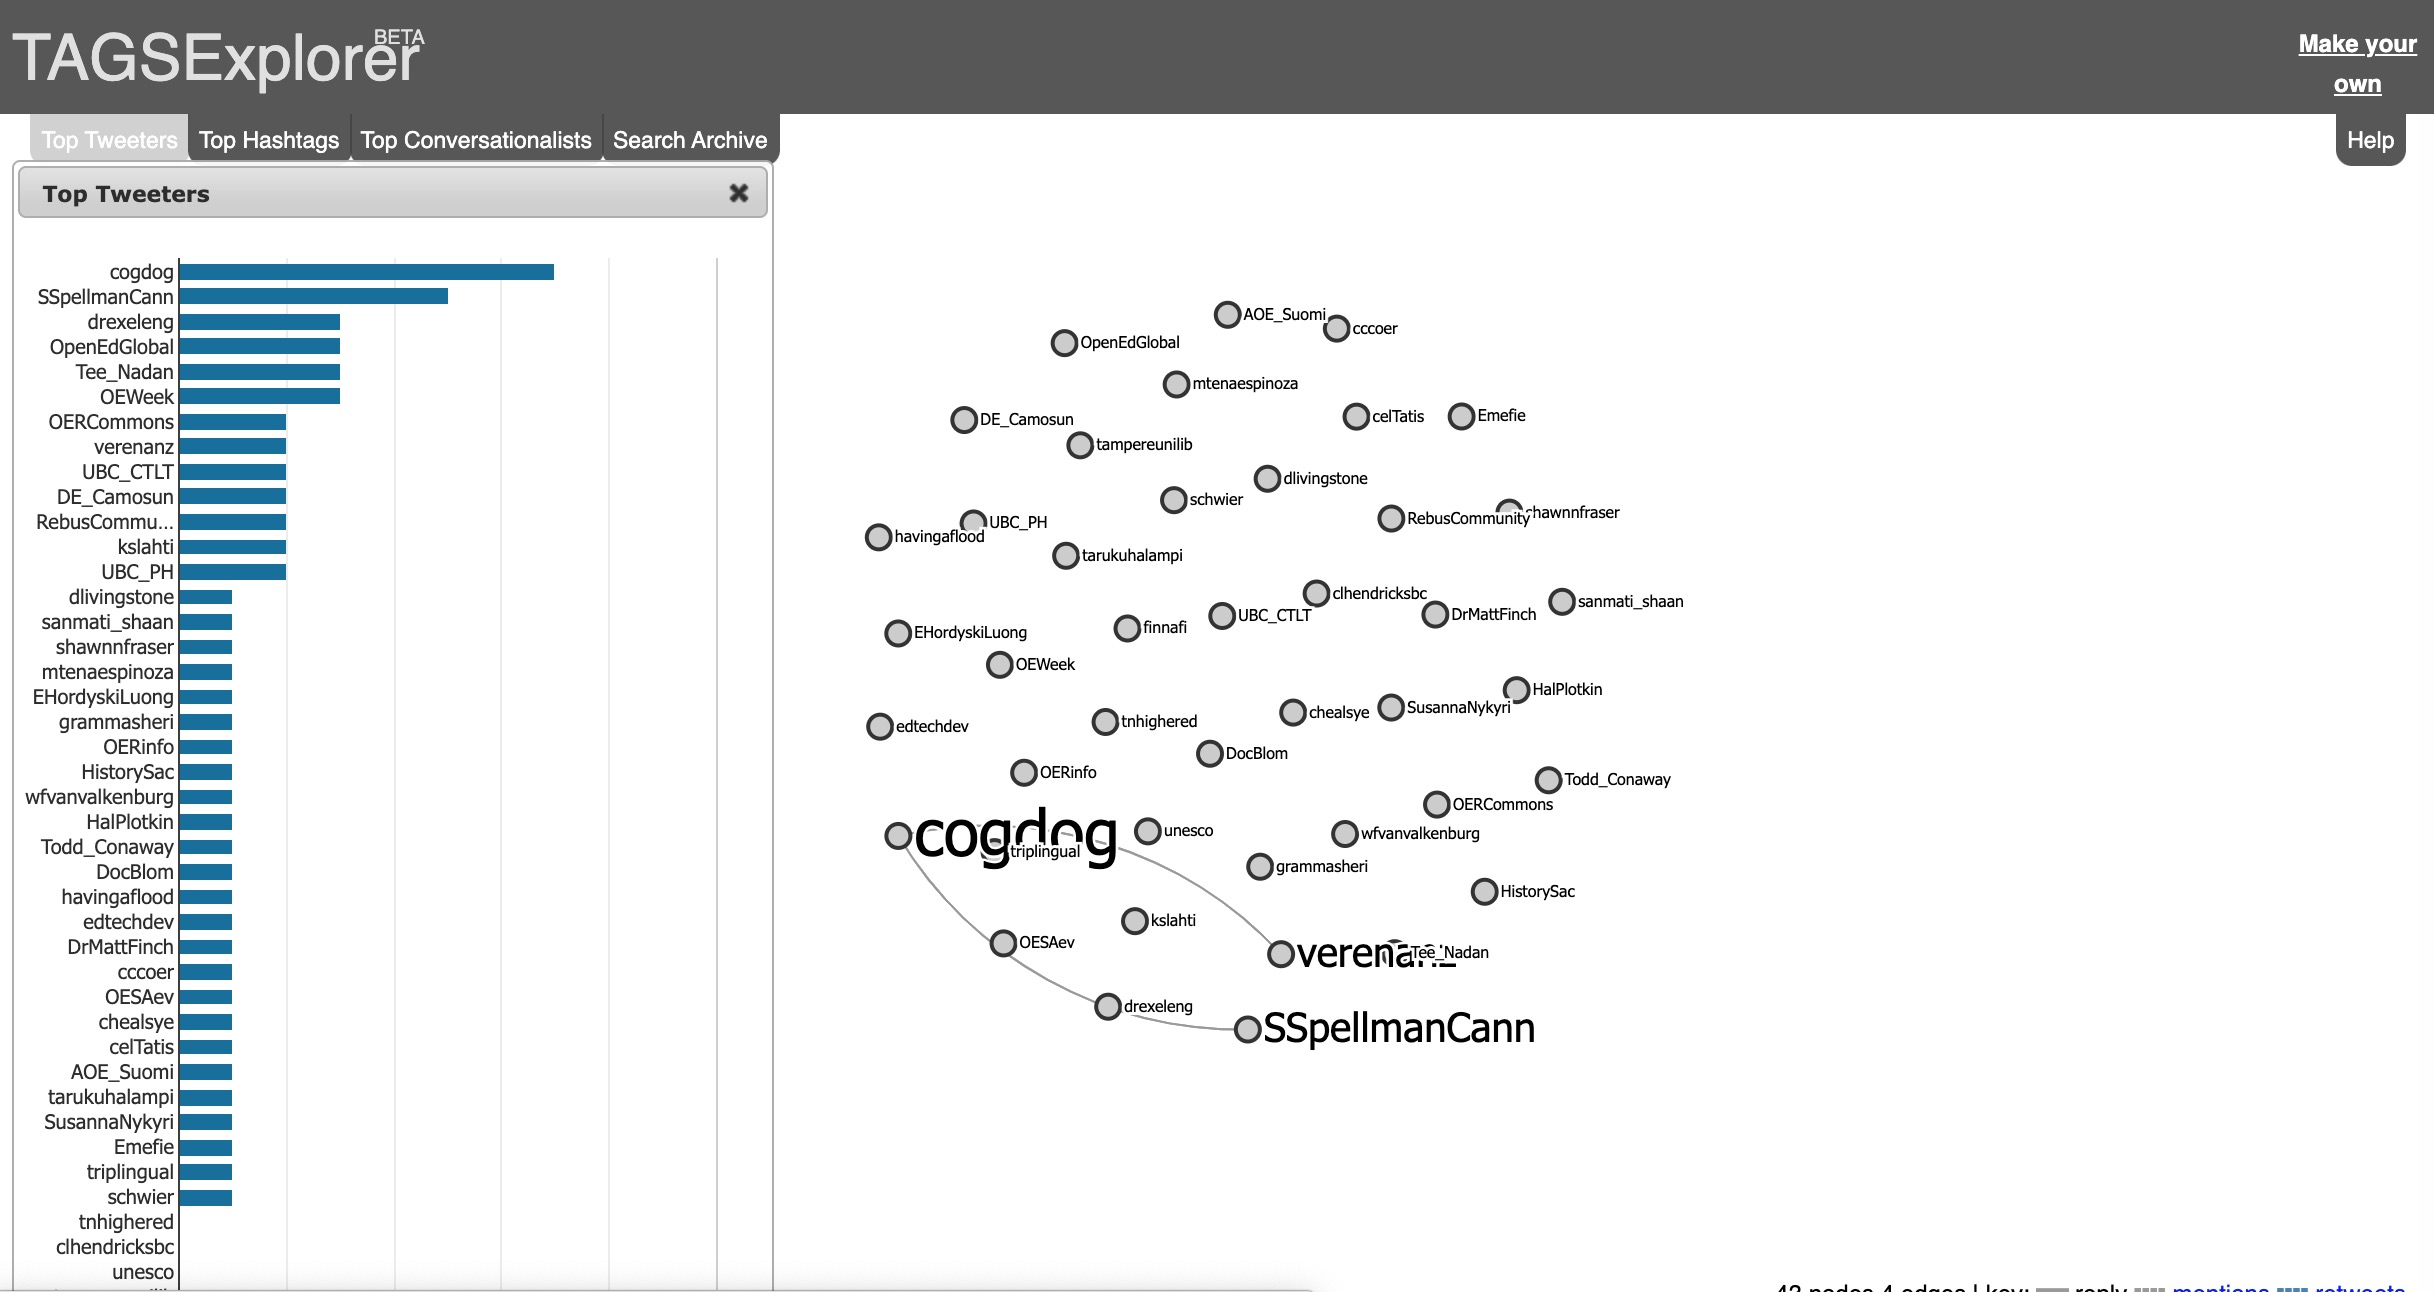
But the most engaging part is the Conversation Explorer, a visualization of all tweets tagged #oeweek showing all participants, the size of a twitter name is proportional to the number of tweets matched, and lines connecting them representing “conversations” in terms of replies and mentions.
As things are ramping up, it is just getting started, the tabs on the top left produce a graphed display of the most active participants:
(I seem to be noisy).
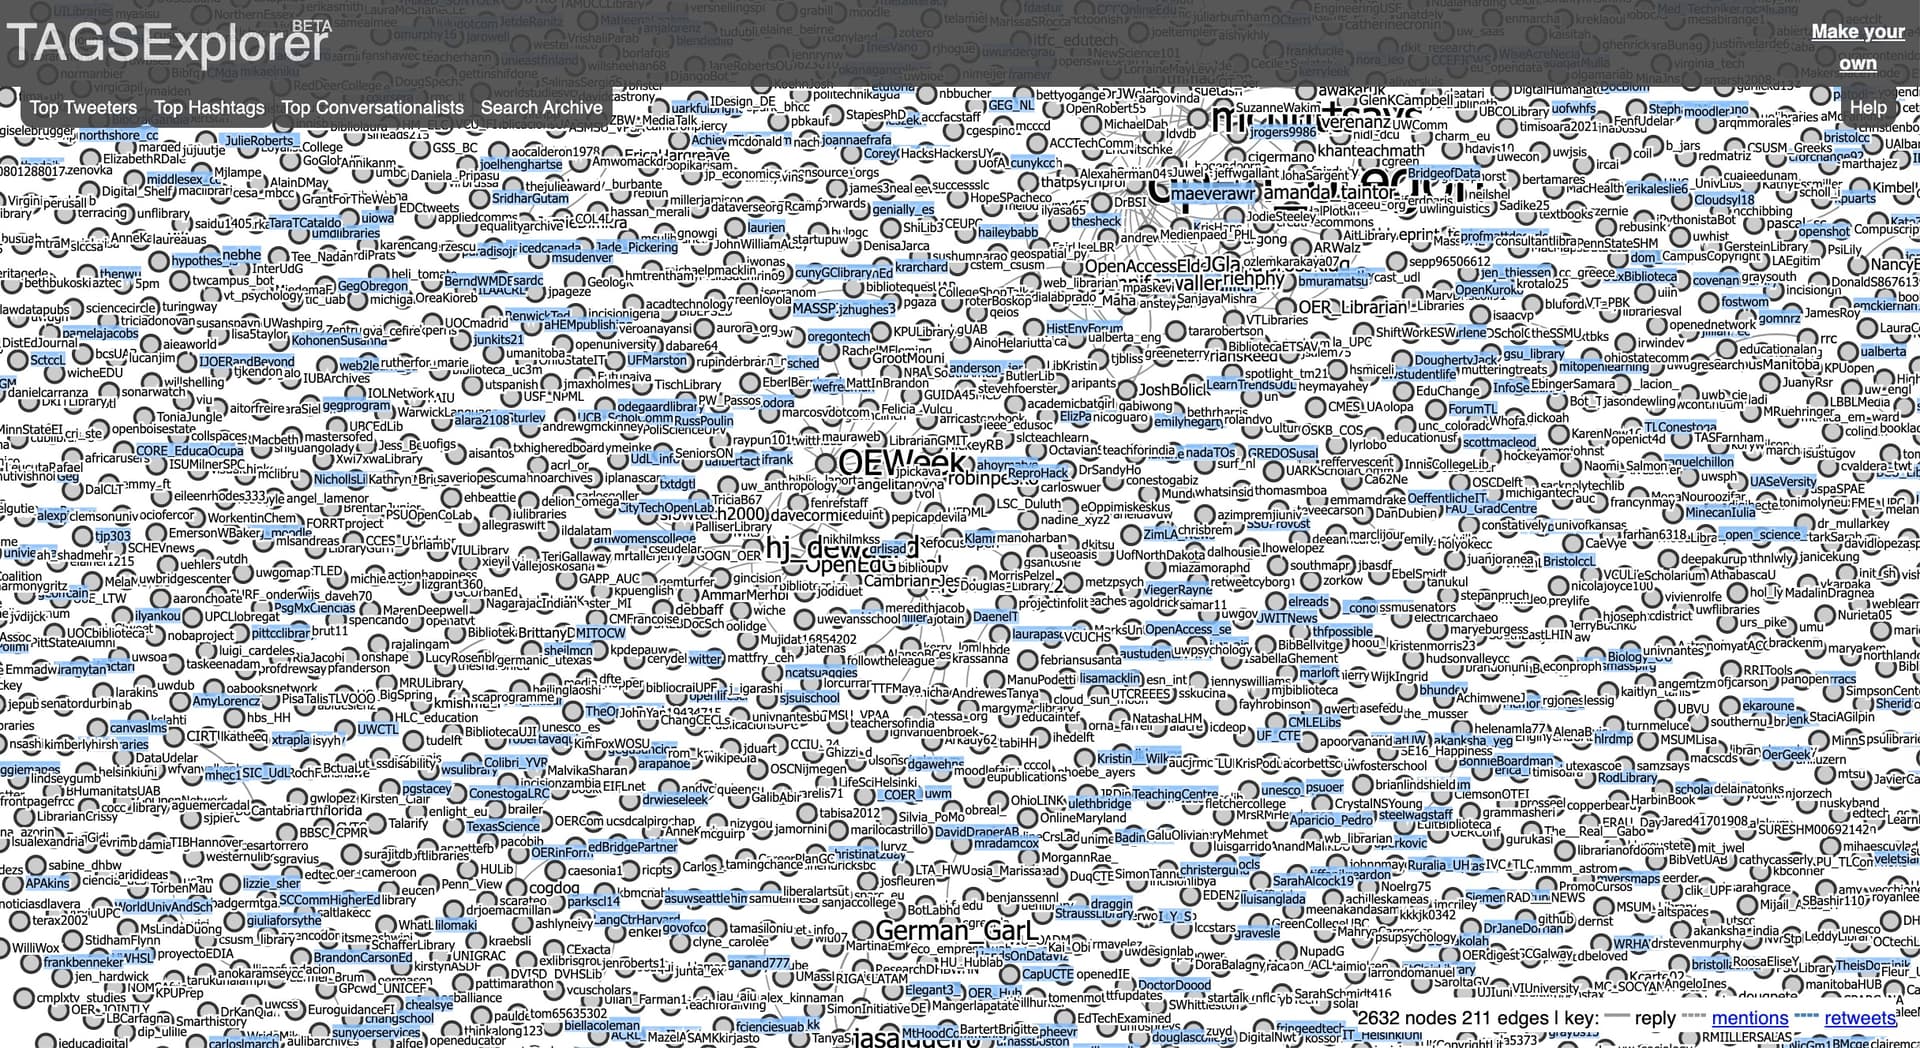
For comparison, see the Conversation Explorer collected for the entire year of OE Week tweets in 2021, where there were over 5000 tweets collected.
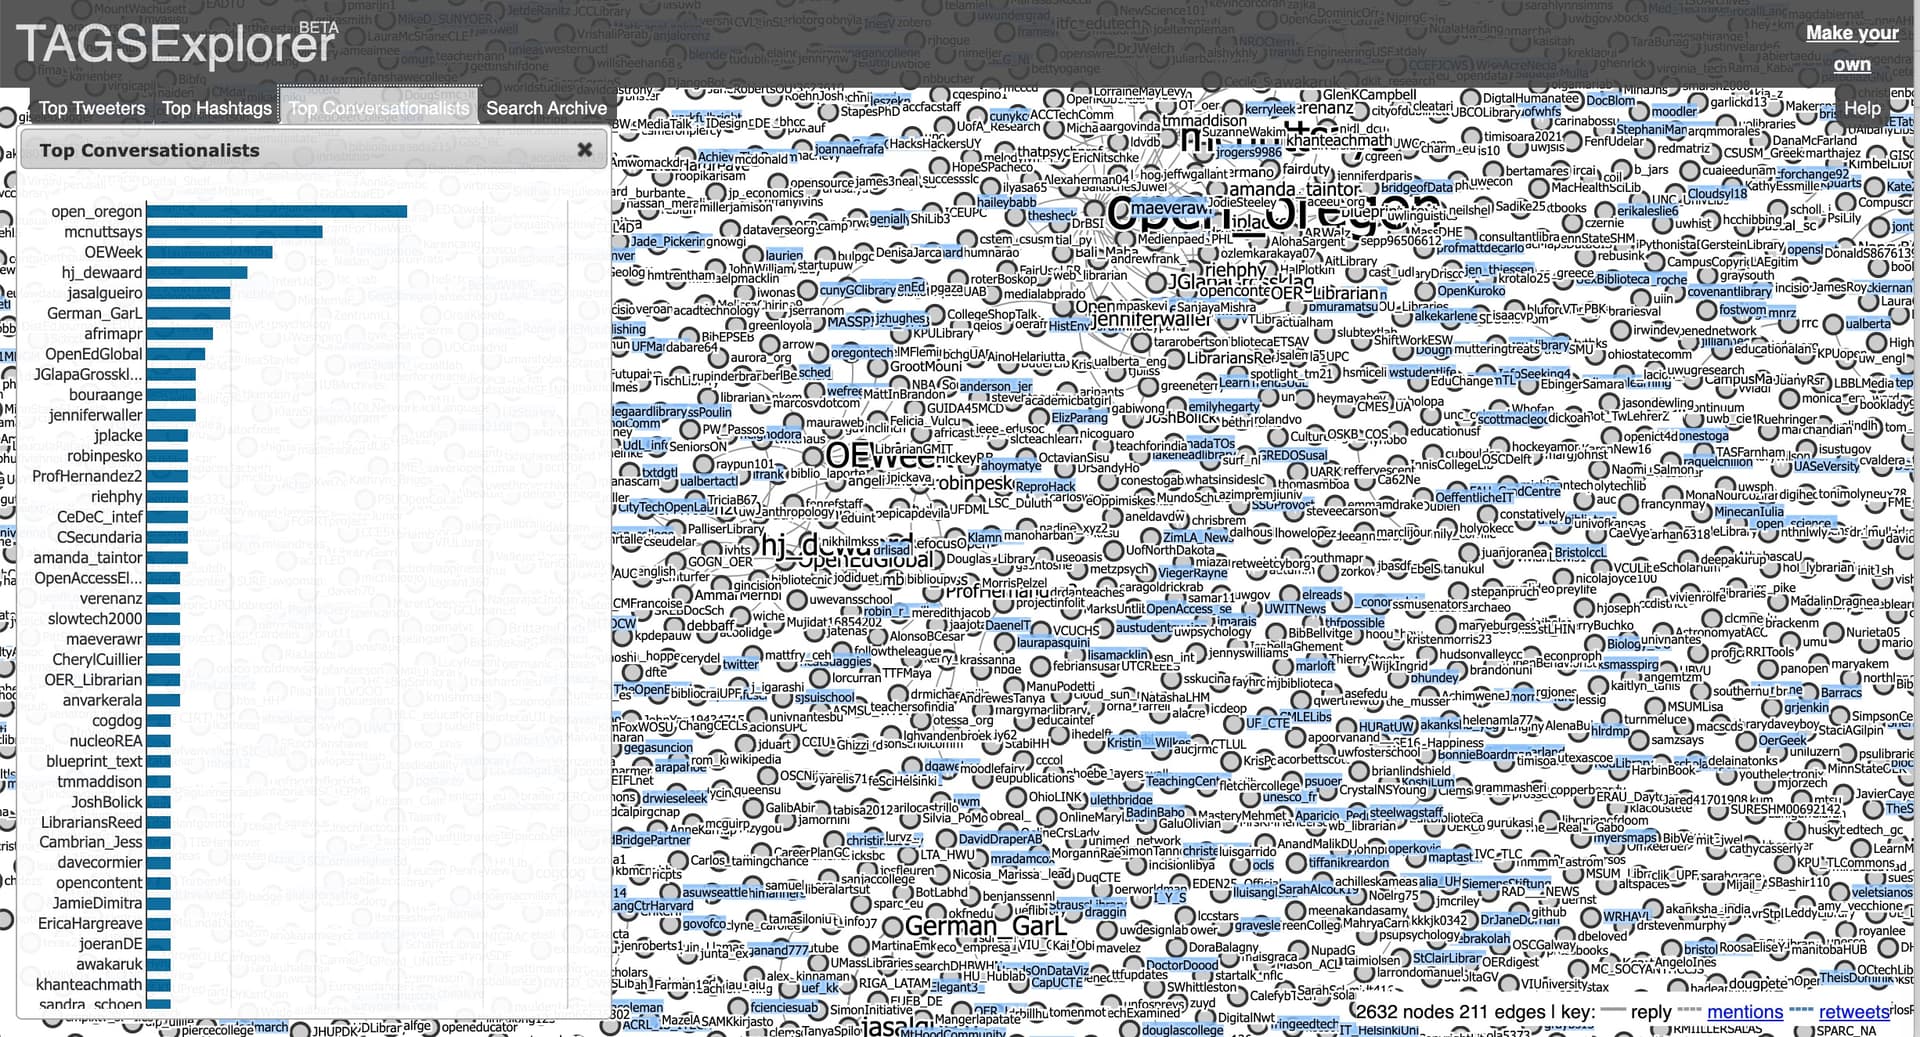
It’s almost unreadable! A two finger slide up and down on a laptop trackpad provides soe zoom capability. But again, more insight is available via the charts available in the top left, such as the Top Conversationalists (ranking based on tweets, replies, and mentions).
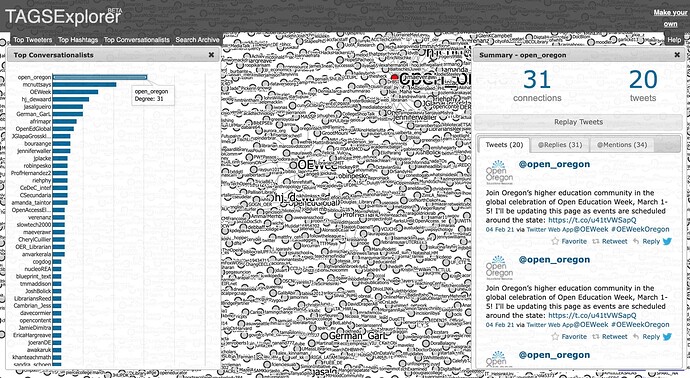
And if you click on any of the bar charts, you can see a summary of that one twitter accounts OEweek twitter activity – Go @open_oregon
And here is a secret (well not so secret, maybe less obvious) trick, if you tack on &name=twittername (no @) to any conversation explorer url, you can review the activity of one account within the network-
To really see something really interesting, explore the Replay Tweets button in there summary!
The way to do this for 2022 is to start with the URL for this year’s visualization https://hawksey.info/tagsexplorer/?key=1PNH5SxHbOdlyPd8ooTGaTRTyvRys6Fp_peRg9gvhCqs&gid=400689247 and add on to it ?name=TWITTERNAME (no @), like:
So tweet and tweet often this year with #OEweek tags and keep your eye on the growing map of twitter conversation.
