Tagged for OEG Connect: Which countries are leading in AI? | Stanford HAI

What’s of interest? Which countries are leading in AI? | Stanford HAI

Tell me more!


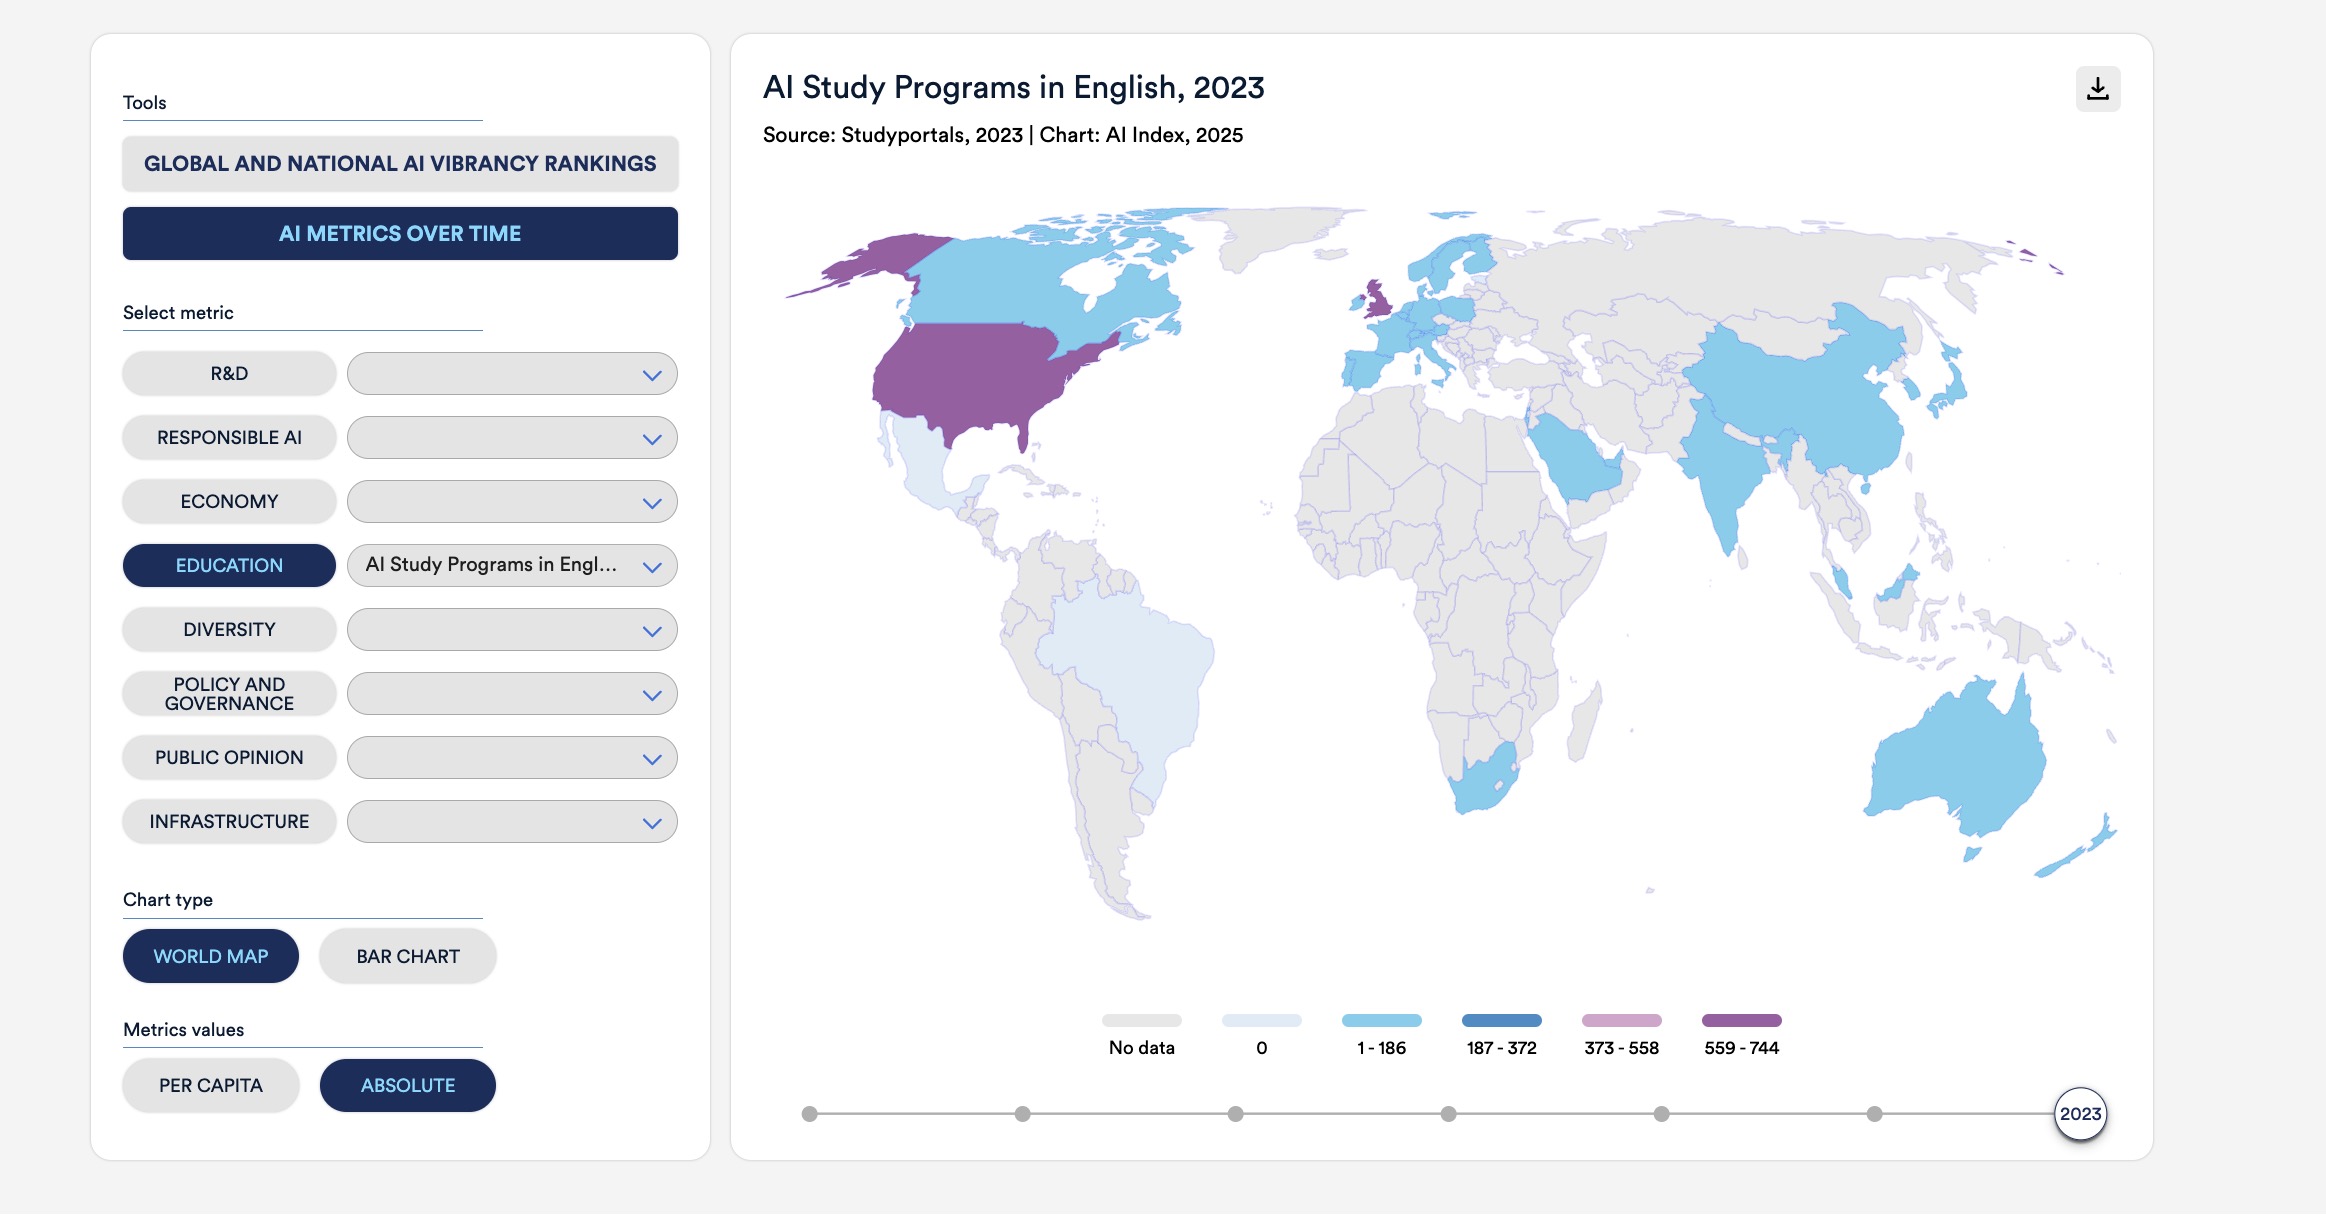
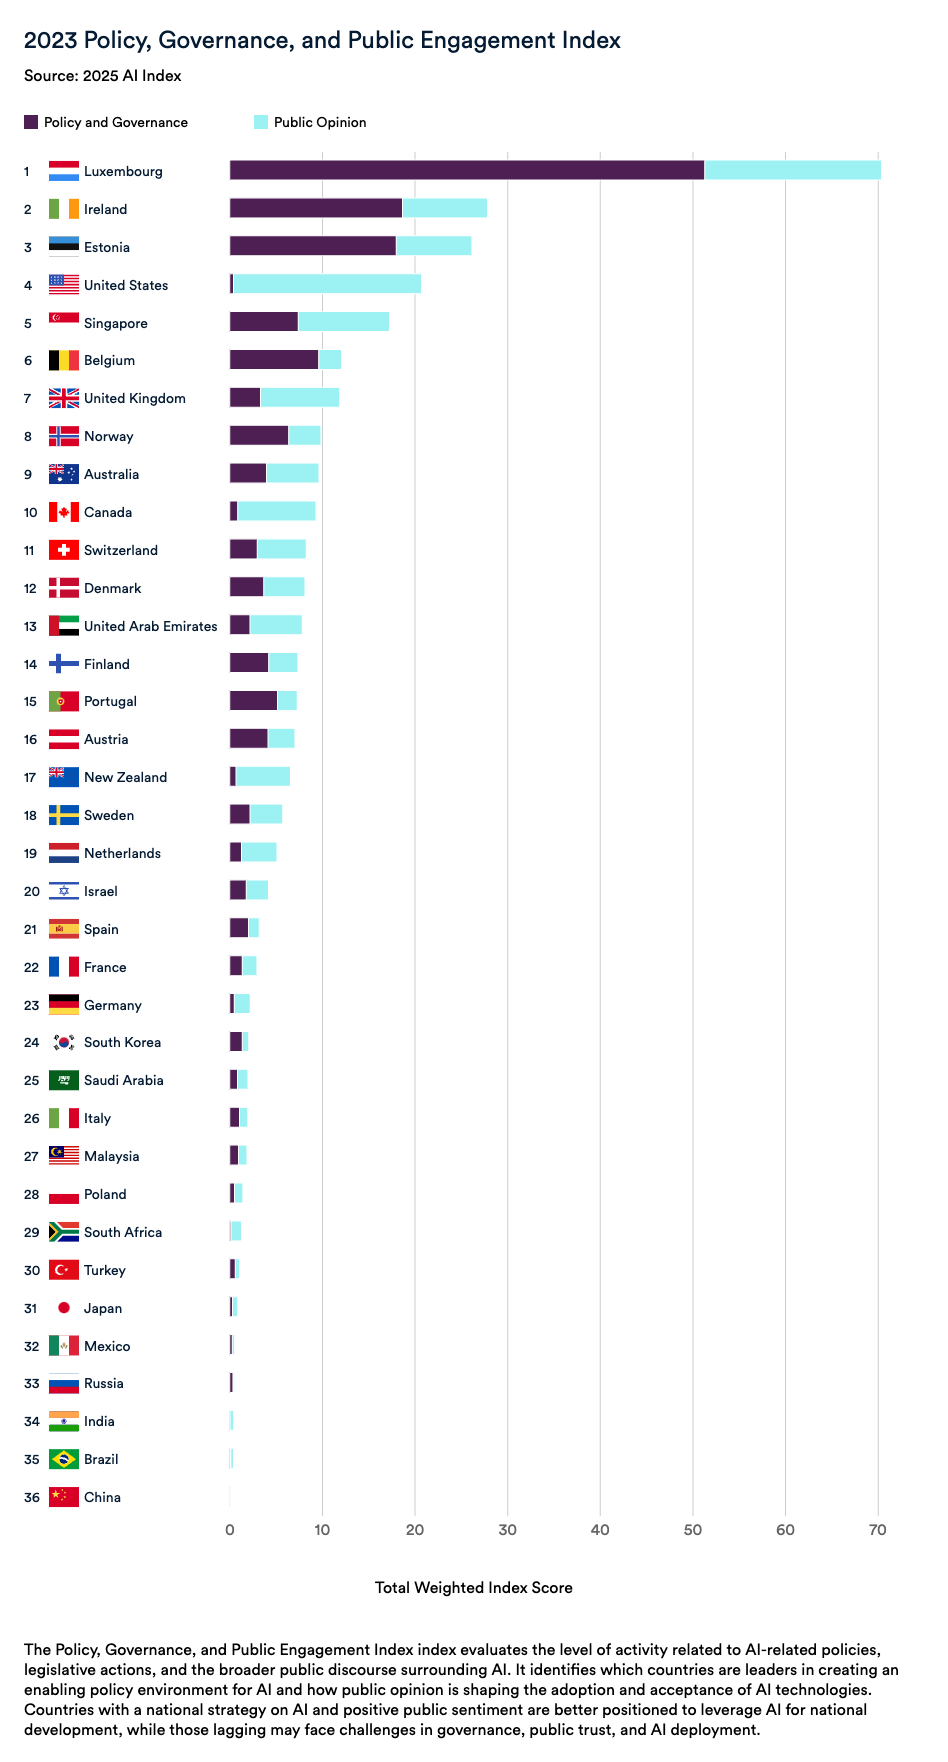
The Global AI Vibrancy Tool is an interactive visualization that facilitates cross-country comparisons of AI vibrancy across 36 countries, using 42 indicators organized into 8 pillars.

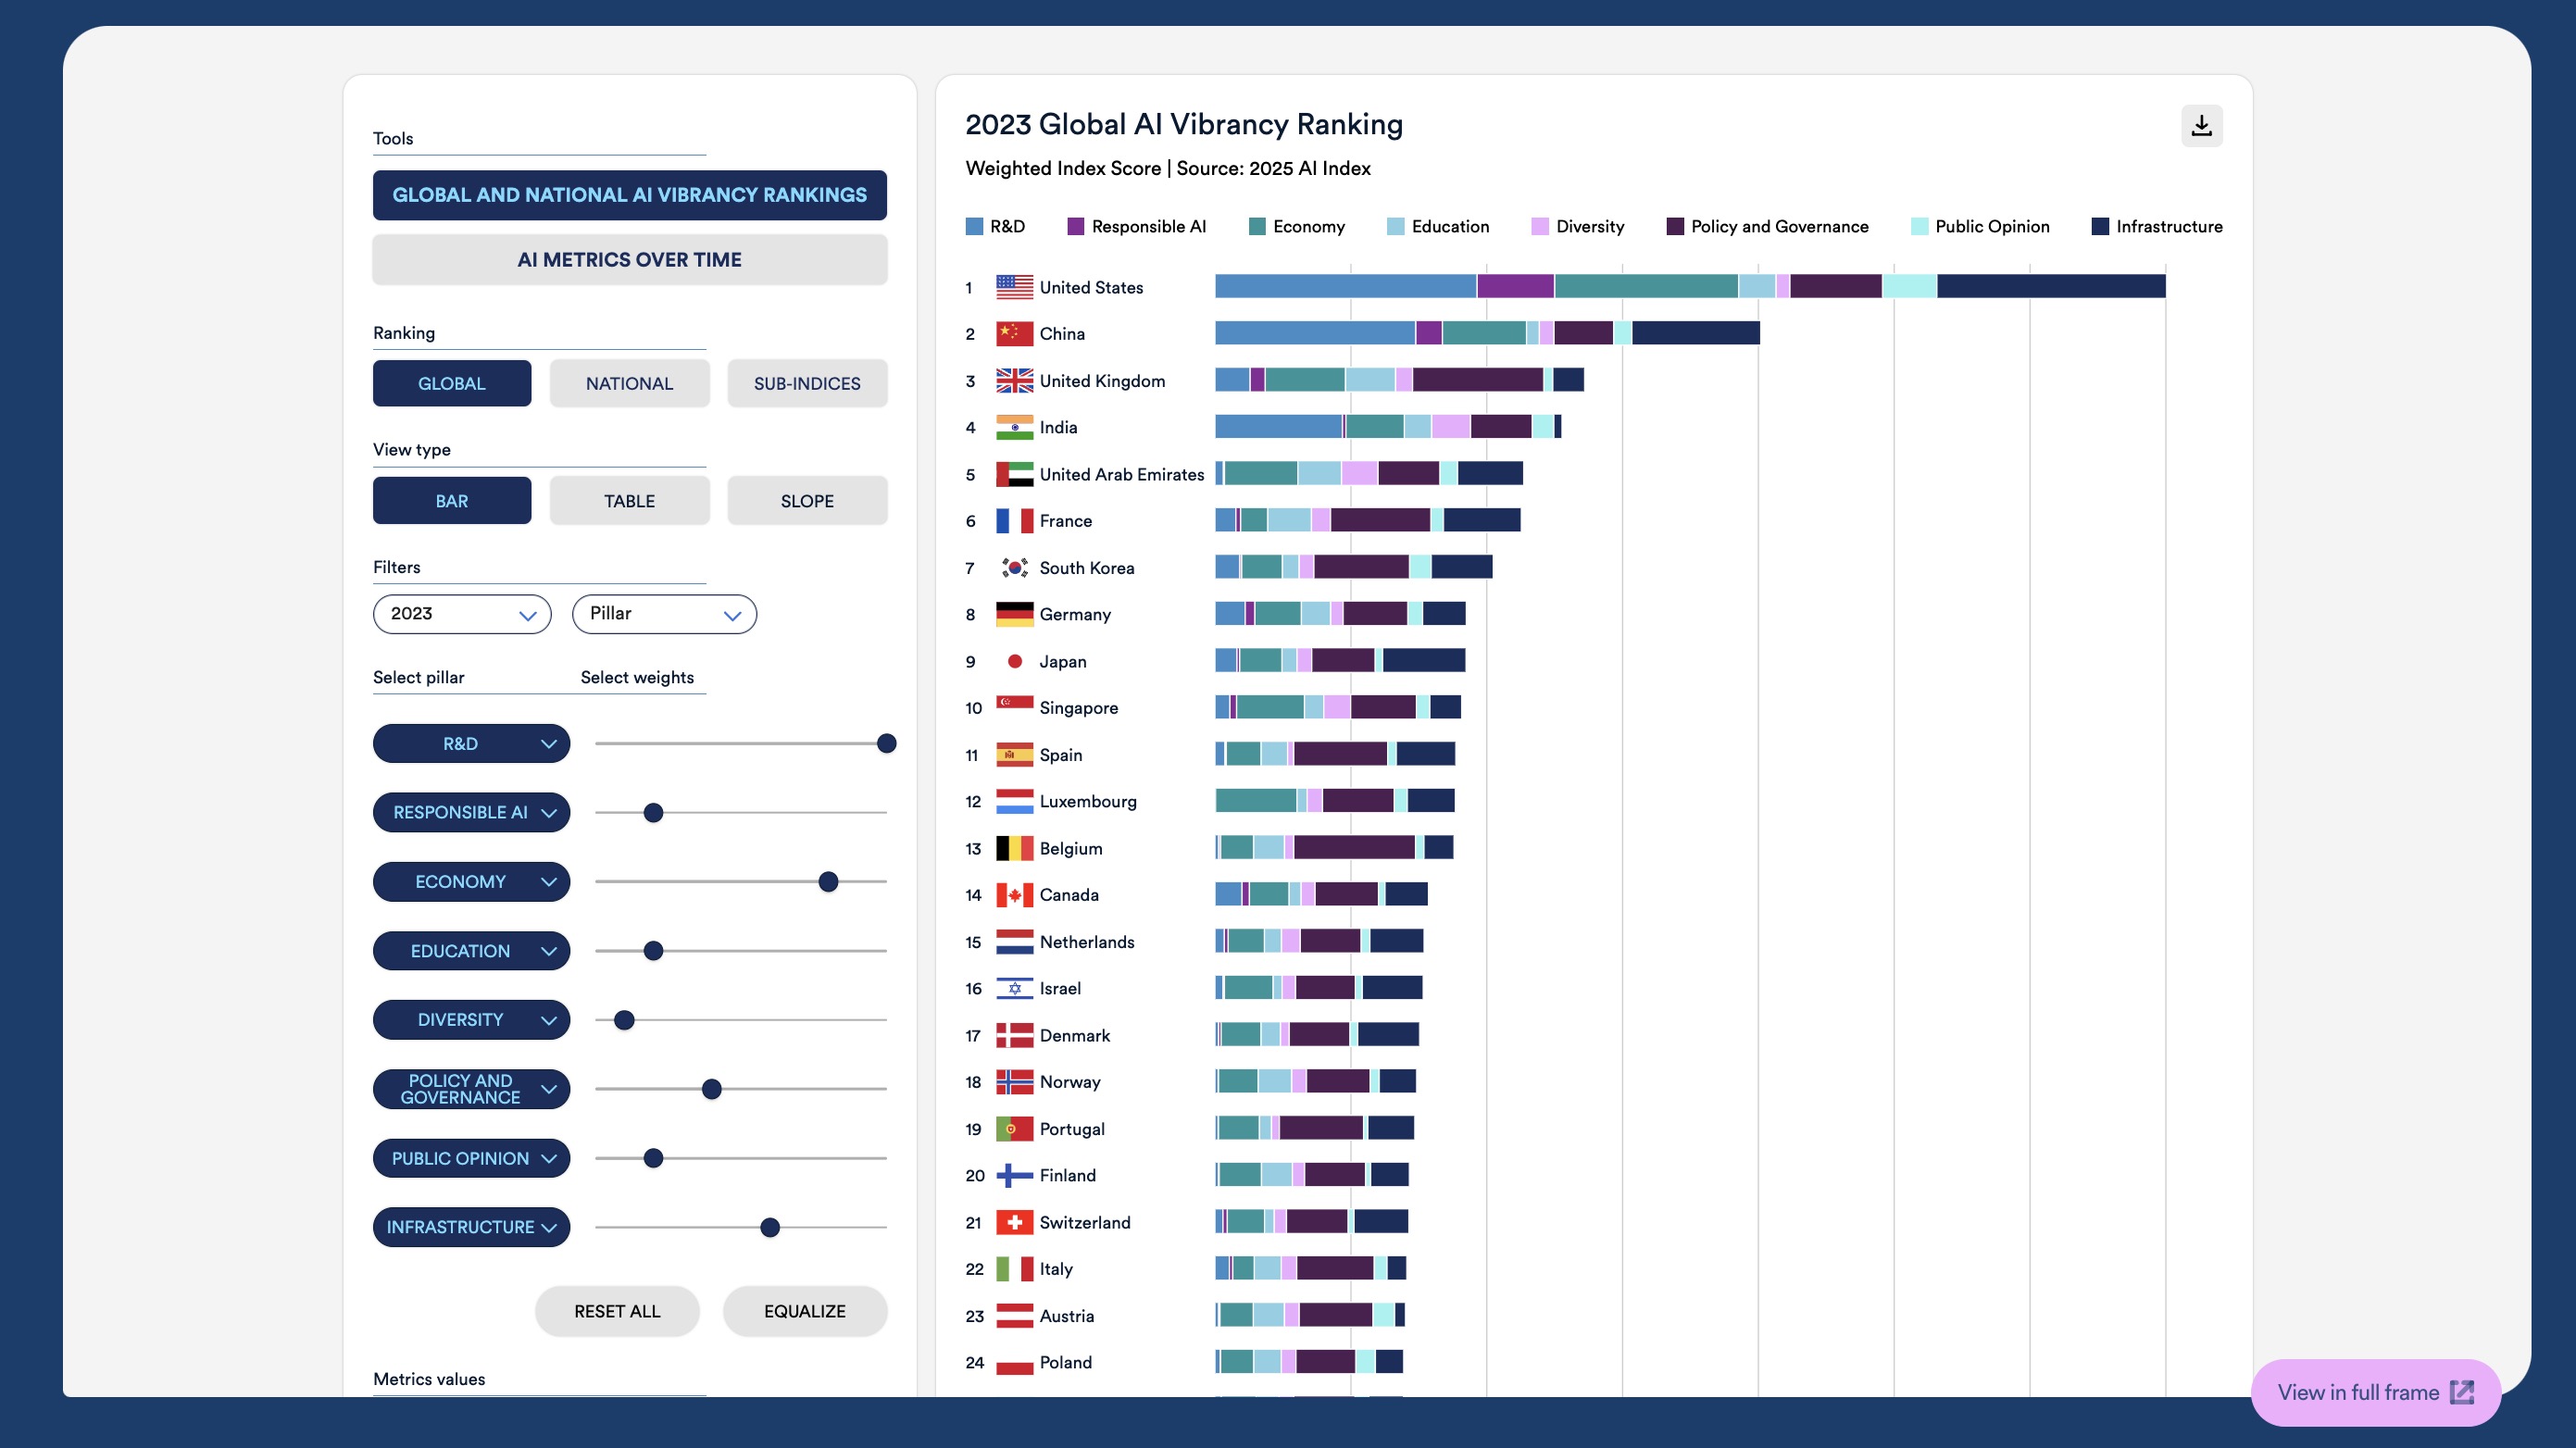
The Global and National AI Vibrancy Rankings tool provides a comprehensive global ranking of countries for each year from 2017 to 2023, along with detailed metric-specific comparisons to see how each country performs relative to others. The AI Metrics Over Time tool offers time-series data for all available metrics at the national level, enabling in-depth analysis of trends and progress over time.

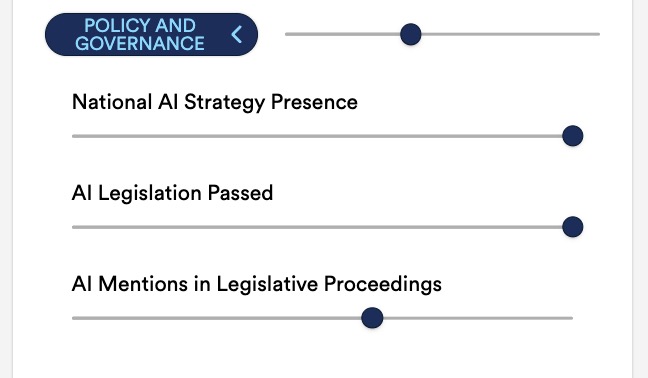
The Global and National AI Vibrancy Ranking includes a default weighting schema based on the AI Index team’s assessment of the relative importance of various pillars and indicators. However, users are welcomed to adjust the weights of both pillars and indicators to reflect their own perspectives on their relative importance.

Where is it?: https://hai.stanford.edu/ai-index/global-vibrancy-tool


This is one among many items I will regularly tag in Pinboard as oegconnect, and automatically post tagged as #OEGConnect to Mastodon. Do you know of something else we should share like this? Just reply below and we will check it out.

Or share it directly to the OEG Connect Sharing Zone

2 Likes

Wow, there is a lot to explore here in this visualization of global activity in AI “comparisons of AI vibrancy across 36 countries, using 42 indicators organized into 8 pillars” for years 2017-2023-- makes for a lot of variables to explore-- and my exploration was just over lunch (soup and salad, if you want to know).

The demo video might have helped if I saw it first :wink:

The metric of Education is “represented” by AI Study Programs in English (?), but you can example by a map view, which you could compare over years.

The "8 pillars: of R&D, Responsible AI, Economy, Education, Diversity, Policy and Governance, Public Opinion, Infrastructure can be weighted as well-- I have not done much to better understand what one does with the weightings. And I note that the data for “Public Opinion” is solely from social media stats, maybe not the ultimate source??

And all the pillars have sub weightings, like for Policy and Governance:

I went deeper into the Policy, Governance, and Public Engagement Index, described as:

The Policy, Governance, and Public Engagement Index index evaluates the level of activity related to AI-related policies, legislative actions, and the broader public discourse surrounding AI. It identifies which countries are leaders in creating an enabling policy environment for AI and how public opinion is shaping the adoption and acceptance of AI technologies. Countries with a national strategy on AI and positive public sentiment are better positioned to leverage AI for national development, while those lagging may face challenges in governance, public trust, and AI deployment.

Where I charted it in 2017, 2020, and 2023.

I hope some of the savvy folks here can rummage around during their lunch break and find things of interest.

Regardless, this is one fantastic data visualization!

1 Like